

If you ever have the misfortune to read the comment sections of the social media on the internet, you will discover that 99% of American do not know what the United States is. Some say that it is a “Republic”. While others say that it is a “Democracy”. There are reasons why people use these terms, but they are all wrong. Today, the United States behaves functionally as an Oligarchy. And this post will prove it.
Now, you the reader might ask, why is this important?
Well, it is very important for the very simple reason that oligarchies do not last. They never last, and when they collapse it is often catastrophically.
Thus to fully appreciate what this post is saying, you need to recognize that no one can live on “borrowed time” for long. Eventually, everyone “must pay the dues” that accrue. This was true back three thousand years ago and it is true right now.
This post was written in January 2020, right before the COVID-19 coronavirus forced China to go into a full military DEFCON ONE lock-down, and right before the economic collapse of the United States in early March 2020.
The following is a reprint of an article titled “Oligarchy in America: How the 0.1% Rob Everyone Else Blind – 31 Shocking Data Points” with a sub-title that says “The rich are getting richer, and everyone else is getting poorer” . It was written by Jon Hellevig on Friday 17JAN20. It was edited to fit this venue, but aside from that, no other changes were made. All credit to the author and original editors.
The rich are getting richer, and everyone else is getting poorer.
There is no hiding anymore, the United States has become an oligarch owned banana republic with nukes, and with a monopoly currency which has allowed it to rig the markets for half a century. But now we are only a couple of hours from curtain – Midnight in America.
With the stock market at all-time highs, virtually no unemployment (or so they say), and brisk GDP growth (supposedly) in the last decade, economic analysts would declare that the US economy is in excellent shape.
This was written just before the United States collapsed economically in March 2020.
But, it isn’t in “excellent shape”.
The stock market is a central bank inflated asset bubble, and what GDP growth there has been, is an illusion brought about by the very same financial bubble and by pumping the economy up with record federal borrowings to finance the deficits that America cannot afford.
Rigged statistics showing artificially low inflation serve to hold together the Trumped-up American economic narrative. (About the rigged inflation statistics, see this report). And the low unemployment figure is nothing but a chimera based on misleading.
The US Economy is failing
Actually, as of 20MAY20, it has failed. And people are now considering just how far it will collapse. Even the most optimistic are thinking in terms of months. When the reality might very well be decades.
In reality, the US economy is failing – and the country with it. At least two-thirds of the population has seen dramatic declines in living standards and half are back to levels of developing nations – without the development.
People are turning into impoverished serfs.
The big story covered up by all the happy macroeconomic figures repeated by rote by the US establishment – everybody from the president to cable television pundits and Trump fanboys – is the gradual impoverishment of the American worker.
That’s an inconvenient truth increasingly difficult to hide as the American dream has turned into a nightmare for huge swathes of the population.
The rich are now obscenely wealthy.
As the figures we present below show, the rich are really getting richer, the middle class has been decimated, and half of Americans are poor and destitute of any financial wealth.
Keep in mind that an Oligarchy is rule by the rich. It is in their best interests to have a dual-tiered government and system. One for them, and one for everyone else. Thus, it makes sense that in an oligarchy, the rich get richer, while the poor get poorer.
The super-rich are gobbling up an ever-increasing slice of the American pie at the cost of all the rest who get nothing but table scraps on one side and leftover crumbs on the other, if anything.
The resulting stratification of society has brought back a medieval servant economy, where the have-nots are doing odd jobs, cleaning houses, fetching groceries, running errands and deliveries for the feudal rich and the remaining shrinking middle class.
Thanks to the Fed (the American oligarch owned central bank) pushing easy money into the hands of the privileged elite…
… now the super-rich Dismal Decimal – the top 0.1% – …
…have by now amassed as much wealth as they had just before the Great Depression. A depression that started with the stock market crash in 1929.
A lesson not learned.
Back to square one. How will it end this time?
BTW all the data in this report is derived from official US government sources and American experts analyzing them.
Just how the Oligarchy has rigged the game against the citizens…
During the last decades, the financial rewards from the rigged markets first flew exclusively into the pockets of Top 10%, but later it was increasingly Top 1%, which pocketed most, perfectly illustrated by the charts below.
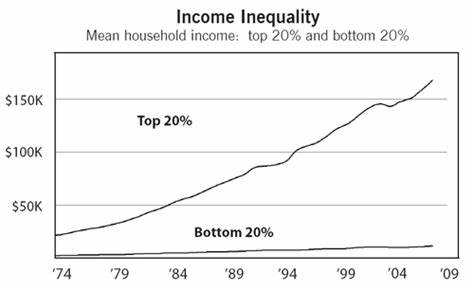
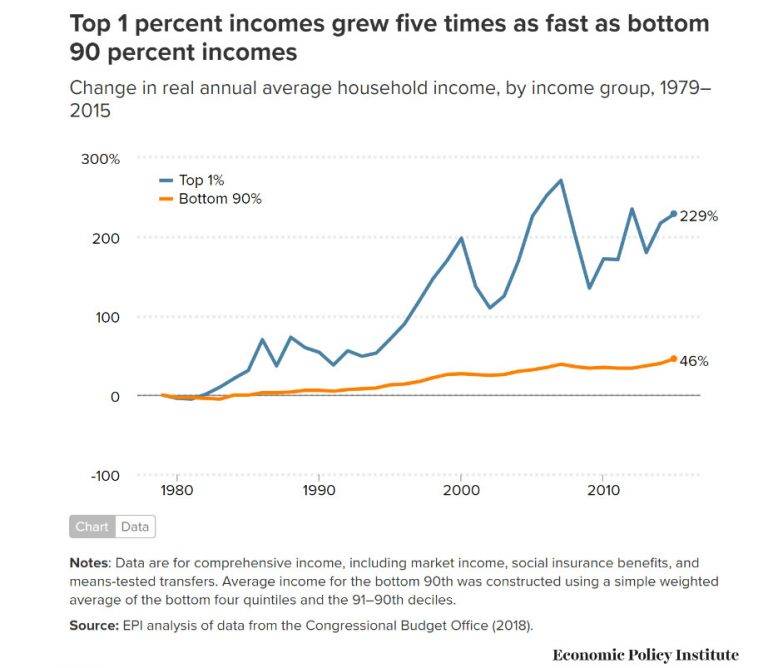
1. Income for the rich just accelerates upward.
The income of Top 1% has grown five times as fast as that of Bottom 90% income since 1970, who now earn double the amount of income than 160 million poor of the lower 50% stratum.
- Oligarchy in America: How the 0.1% Rob Everyone Else Blind …
- New data shows income of top 1% has grown 100 times …
- ‘Staggering’ New Data Shows Income of Top 1% Has Grown 100 Times Faster Than Bottom 50% Since 1970
- ‘Staggering’ New Data Shows Income of Top 1% Has Grown …
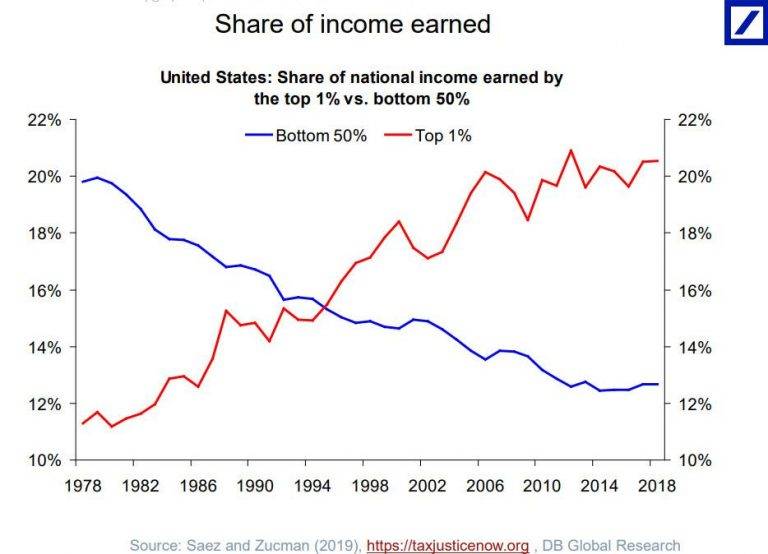
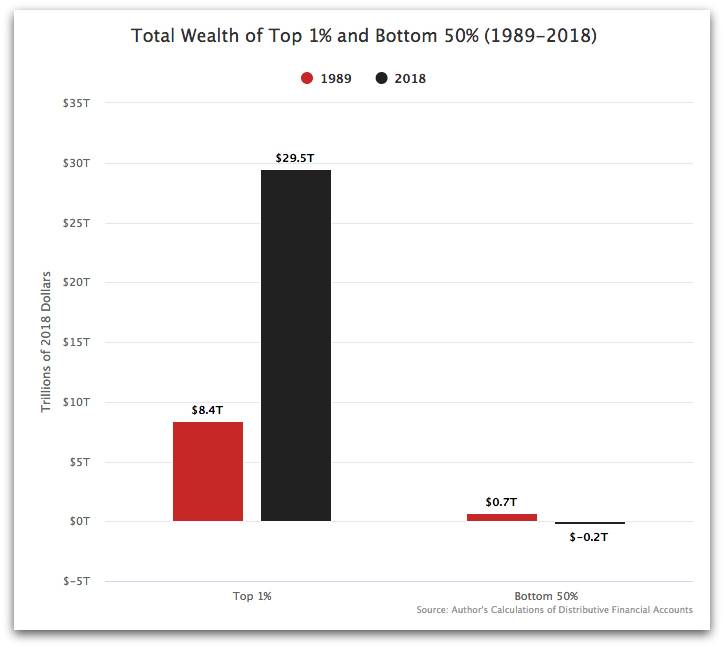
The fortunes of Top 1% and Bottom 50% are now reversed.
2. The rich now own almost all the available money.
Top 1% now holds as much wealth as Bottom 50% combined.
Income inequality obviously leads to wealth inequality, but here the figures are yet more striking in showing the magnitudes of the grab at the top. Since 1989, Top 1% captured $21 trillion in wealth, while Bottom 50% lost $900 billion, actually pushing them down to negative wealth, meaning they have more debt than they have assets.
On a net analysis, half of Americans own nothing of real value.
- Richest 1% of Americans Close to Surpassing Wealth of …
- Chart: The wealth distribution in the U.S. since 1988 – Axios
- The 1% Owns Almost As Much Wealth As The Middle Class …
- Top 1% Up $21 Trillion. Bottom 50% Down $900 Billion …
- The 3 Richest Americans Hold More Wealth Than Bottom …
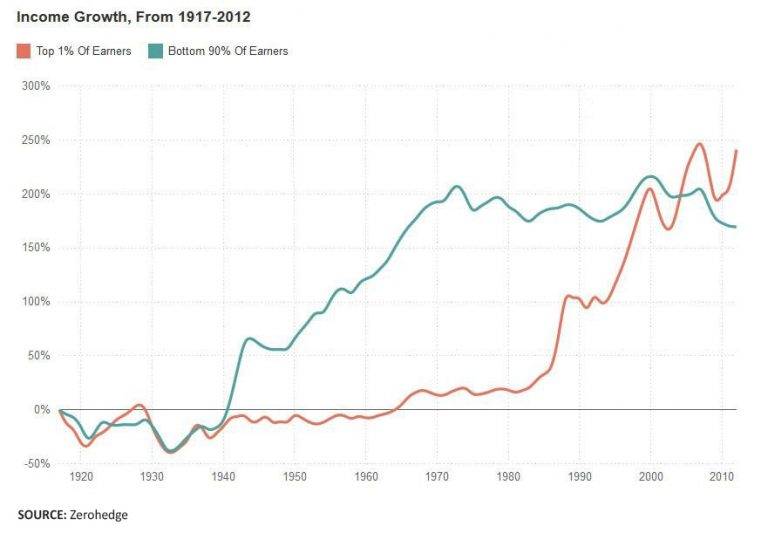
The Change began under President Reagan.
Until the creeping coup under Reagan, income equality was improving
It was bad enough in 1995 when Top 1% earned as much as Bottom 50%, but today the richest 1% already take 20% of all income leaving the bottom half with only 12%. As the chart shows, back in 1978 – before the neoliberal creeping coup really got going – the trends were reversed. Below chart compares income growth since 1920 of Top 1% to Bottom 90% (that is, all the rest except Top 10%). We see that right after Ronald Reagan entered the presidency with his Chicago School snake oil influenced backers, the income growth of the 1% started its dizzying growth, which is continuing to this date.
- Under Reagan, rich got richer, but the poor have gained …
- This cartoon explains how the rich got rich and the poor …
- The wealth that failed to trickle down: The rich do get …
- This Chart Shows How Reaganomics Has Destroyed The …
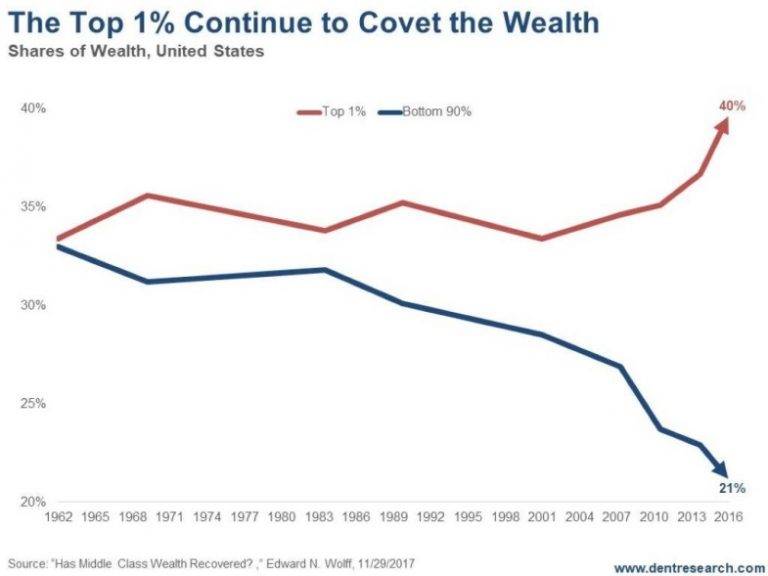
4. Rich became super-rich.
Money isn't the only system being used to isolate the oligarchy from the common people.

"Phoenix is the conceptual model for the DHS (US equivalent of RSHA under the NSDAP- my note). Both are based on the principle that governments can manage societies through implicit and explicit terror. The strategic goal is to widen the gap between the elites and the mass of the citizenry, while expunging anyone who cannot be ideologically assimilated."

-Dr. T. P. Wilkinson
Back in 1962, the share of Top 1% of America’s wealth at 33% was equal to that of Bottom 90%, but in the early 1980s the share of Bottom 90% started a steep descent and by 2016 their share had dwindled down to 21%.
Especially after the Federal Reserve shifted its market rigging low-interest-rate money-pumping policy into high gear from the beginning of 2000s, the superrich have experienced a massive rise in their fortunes, as illustrated by below chart.
- As the rich become super-rich, they pay lower taxes. For …
- The Rich and the Super-Rich: A Study in the Power of Money …
- How the super rich got richer: 10 shocking facts about …
But by today Top 1% are losers compared with Top 0.1% – the Dismal Decimal – who are where the music plays.
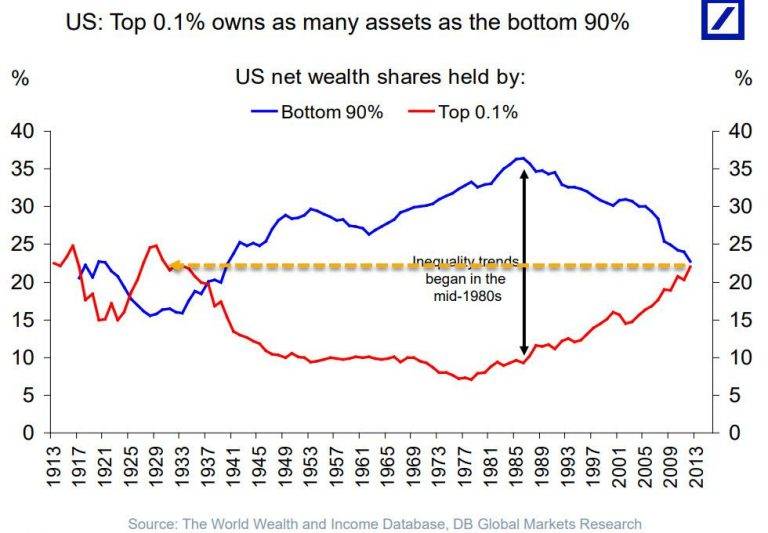
5. Top 0.1% now holds as much wealth as Bottom 90% combined.
A recent study revealed that the concentration on the top is yet much more pernicious.
It’s not any more a question of Top 10%, and not even Top 1%, as it is the Top 0.1% – the Dismal Decimal – that has now concentrated the wealth of the nation (and half the world) in their greedy hands.
Top 0.1% now holds as much wealth as Bottom 90% combined.
As the below chart shows, we are essentially back to the Roaring Twenties…a lesson not learned.
Actually, in the aftermath of the Great Depression, America entered an unprecedented era of four decades of prosperity with a more equal distribution of wealth as Bottom 90% recovered strongly in distribution of wealth at the expense of Top 0.1% parasites.
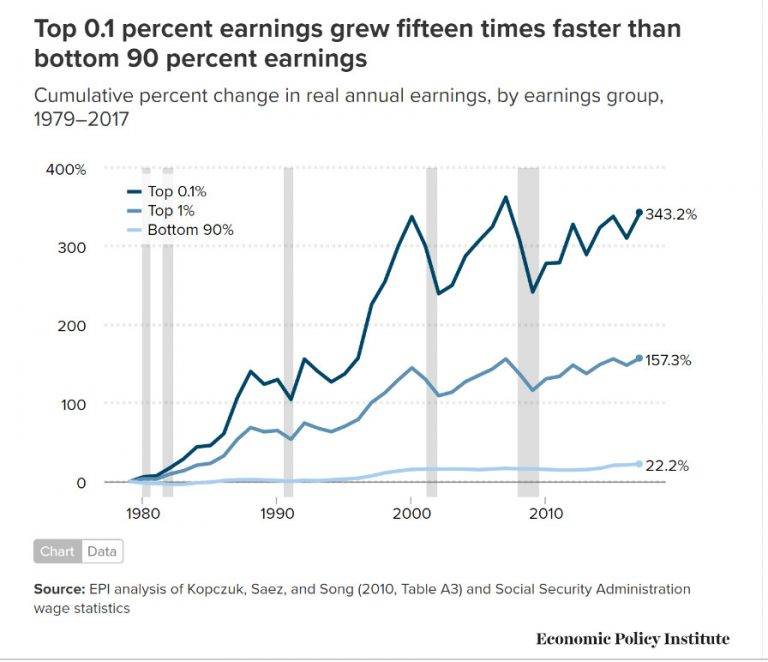
6. Top 0.1% earnings grew 347% between 1979 and, while Top 1% “only” gained 157% – the rest gained nothing
- Top 0.1% earnings grew 347%
- Top 1% earnings grew 157%
- The rest 98.9% grew 0%.
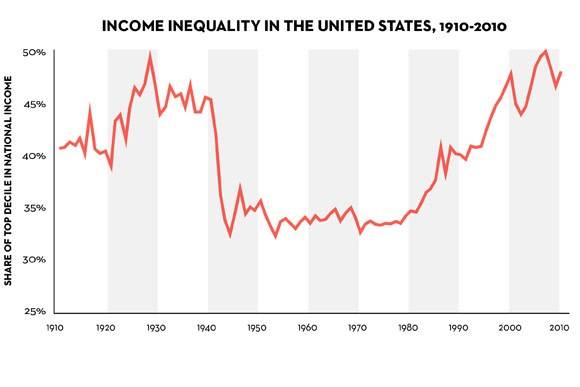
7. The share of total income is oligarch in nature.
The next chart takes a longer perspective – while widening the sample to Top 10% – and shows their share of the total income since 1910 to 2010.
The Roaring Twenties – the period before the 1929 stock market crash and the ensuing Great Depression – experienced the same level of glaring inequality as today’s America.
- Fed Stunner: Top 1% Of Americans Are 70% Wealthier Than …
- The economic reality for 70% of Americans – Page 3
With Franklin D. Roosevelt’s reforms the egregious average income inequality was tamed and stayed relatively low until Reagan’s fatal presidency. And it’s been downhill ever since – or uphill, if we look at it from the perspective of the rich.
8. The GDP
The only economic figure that has managed to look good is the GDP, but that is so only until you bother to find out where it comes from – from the Federal Reserved fueled asset bubble and massive federal budget deficits financed by record national debts.
For an excellent exposé of how rigged and debt-ridden the US economy is, I refer to my earlier report published on the Saker blog: “New World Order in Meltdown, But Russia Stronger Than Ever” found at https://thesaker.is/new-world-order-in-meltdown-but-russia-stronger-than-ever/
Shortly: The US economy must be seen as a giant Ponzi scheme, which will implode sooner or later. And we are getting to that sooner part now.
20MAY20. We have arrived.
8a. Stock Market
Trump habitually and regularly brags about the stock market reaching another all-time high. But that’s really being out of touch with the electorate.
Stock market gains exclusively flow to the rich increasing inequality and the cost of living for the rest.
- How the rich get richer in every type of stock market …
- The Richest 10% of Americans Now Own 84% of All Stocks
- Who’s getting rich off the stock market? – CNNMoney
Thing is that, beyond the richest 10% very few Americans have a stake in the stock market.
In 2016, the richest one percent held more than half of all outstanding stock, financial securities, and all other sorts of equity. The remainder of those asset categories were held by the rest of Top 10%, who owned over 93% of all stock and mutual fund ownership.
What wealth the remaining 90% may own is largely residential housing, the homes where they live.
According to Jonathan Tepper, the wealthiest 1% own nearly 50% of stock and the top 10% more than 81%. The so-called middle class owns only 8% of all stock.
This also kills the myth that record highs on the stock market would be good for American retirement savings – with the richest few holding all the shares there’s nothing in it for the overwhelming majority.
8b. Pension plans.
A recent report also showed that only 10% of Americans are invested in pension plans. That is down from 60% in 1980.
And those who are, are traditionally more weighted towards bonds and money-market instruments, which suffer from the rigged markets with the artificially low interest rates.
The pension savers are hence literally paying for the super gains flowing into the pockets of Top 1%.
On the other hand the super low interest rates are out of grasp for the all but Top 1% who gobble up the wealth of the nation with that largesse delivered to them by their Federal Reserve.
At the same time the common household is paying double-digit rates on their credit card debt traps.
9. Household wages have been stagnant.
Below Top 10% wages and total household income have been stagnant, at best.
10. Stagnation of incomes for the bulk of Americans.
Average income of the bottom 50% has stagnated at around $16,000 since 1980, while the income of the top 1% has skyrocketed by 300% to approximately $1,340,000 in 2014
11. Almost half of Americans are impoverished.
45% of Americans earn annually only 18,000 or less. A recent study found that 53 million Americans or 44% of the working age population earn a median average annual salary of only $18,000. Basically then, at least half of the Americans are working-poor.
12. Zero change in income for the middle class.
Middle-class households had in 2015 basically the same income as they had in 1979
13. Only the rich got richer.
In the two decades from 1997 to 2017, only Top 5% of households saw their income increase
14. Most American wages did not change at all.
For most American workers, real wages have barely budged in decades. By end of 2018, the real inflation-adjusted average wage had about the same purchasing power it did 40 years ago.
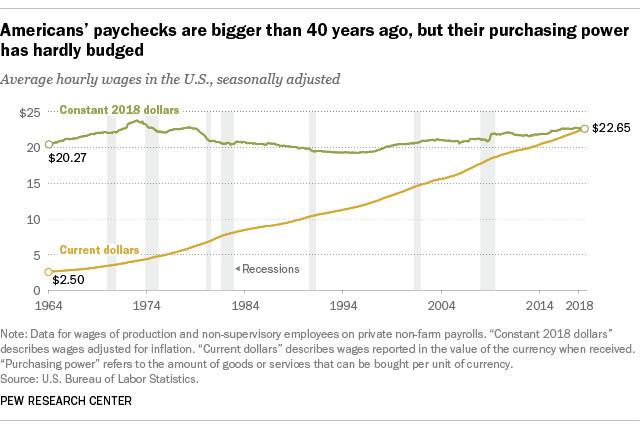
15. Minimum wages have not changed.
As the below chart illustrates, the real average hourly wage which was $20.27 in 1964 had only inched up to $22.27. David Stockman calculated that the real hourly worker’s wage was in 2019 still at 1972 levels.
16. Men’s wages at all levels have fallen.
For full-time employed men real wages have fallen 4.4% since 1973, according to economist Paul Craig Roberts. The total average income of men at $51,212 in 2015, was lower in real terms than it had been in 1974.
17. Rise is “gig work”.
As of 2014, the average hours worked per week had fallen from around 39 hours in 1970s to under 34 hours. Economist Mike Shedlock calculated that the actual hours worked and the average hourly earnings would deliver a weekly income of $690, well below its $825 peak back in the early 1970s. If we multiply the hypothetical weekly earnings by 50, we get an annual figure of $35,497. That would in 2014 have translated to a 16.4% decline from its peak in October 1972.
18. All productively benefit has gone to the rich.
All labor productivity growth since the 1970s have gone to the robber capitalists. From 1973 to 2013, hourly compensation of a typical (production/nonsupervisory) worker rose just 9% percent while productivity increased 74%.
- CEO compensation has grown 940% since 1978: Typical …
- The wedges between productivity and median compensation …
- State of Working America Wages 2019: A story of slow …
- CEO Pay Ratio and Income Inequality: Perspectives for …
19. CEO pay has skyrocketed.
Nowhere is income inequality and the egregious worsening trend as manifest as in the case of CEO pay.
In the 1970s, CEOs made 30 times what typical workers made, but by 2017 the CEOs made 361 times the workers’ pay. According to the Economic Policy Institute CEO compensation has grown 940% since 1978, while typical worker compensation has risen only 12% during that time.
- CEOs see pay grow 1,000%, and now make 278 times … – CNBC
- CEO compensation has grown 940% since 1978
- CEO Pay Skyrockets To 361 Times That Of The Average Worker
- 466 Hours of Worker Overtime Equals One Hour of CEO Pay
- How CEOs Came To Make Hundreds Of Times More Money …
- CEO Pay Has Grown 90 Times Faster than Typical Worker Pay …
- Here’s how much CEO pay has increased compared to yours …
- CEO to Worker Pay Ratios: Average CEO Earns 204 Times …
The Fed fueled financial market orgy is the main cause for the windfall riches of CEOs as stock options and the accompanying share buybacks make up a huge part of CEO pay packages. This rising pay of executives was the main factor in Top 0.1%’s super grab of household income
20. Americans struggle for the basics
A 2017 study found that 40% of US adults struggle to pay for basic necessities like food, healthcare, housing, and utilities.
- Study: 40 Percent of Americans Struggle to Afford Basic …
- Study: More Than 40% Of Americans Struggling To Make …
- A decade after the recession, 40% of U.S. families still …
- 40% of Americans struggle to pay for at least one basic …
- Material Hardship among Nonelderly Adults and Their …
- Almost half of Americans can’t pay for their basic needs …
- More Than 40% of U.S. Adults Struggle to Make Ends Meet
21. Most Americans live paycheck to paycheck.
Most Americans have depleted all their spare resources as a staggering 78% of full-time workers are reported to live from paycheck to paycheck.
- A shocking number of Americans are living paycheck to …
- Most Americans Are Living Paycheck to Paycheck, Survey …
- Shutdown highlights that 4 in 5 US workers live paycheck …
- 78% Of Workers Live Paycheck To Paycheck – Forbes
- Vast number of Americans live paycheck to paycheck – CBS …
- Almost 80% of US workers live from paycheck to paycheck …
22. Most American have zero savings.
Nearly 70% of Americans have virtually no savings. Bottom 55% have zero savings, while the following 24% – the core of the former middle class – have only $1,000 stashed away.
- A growing percentage of Americans have no … – Bankrate
- A fifth of Americans say they have zero savings | Markets …
- Can you guess how many Americans have absolutely no …
- Chart: Most Americans Lack Savings | Statista
- Survey: 69% of Americans Have Less Than $1,000 in Savings
- Majority of Americans don’t have $500 in savings
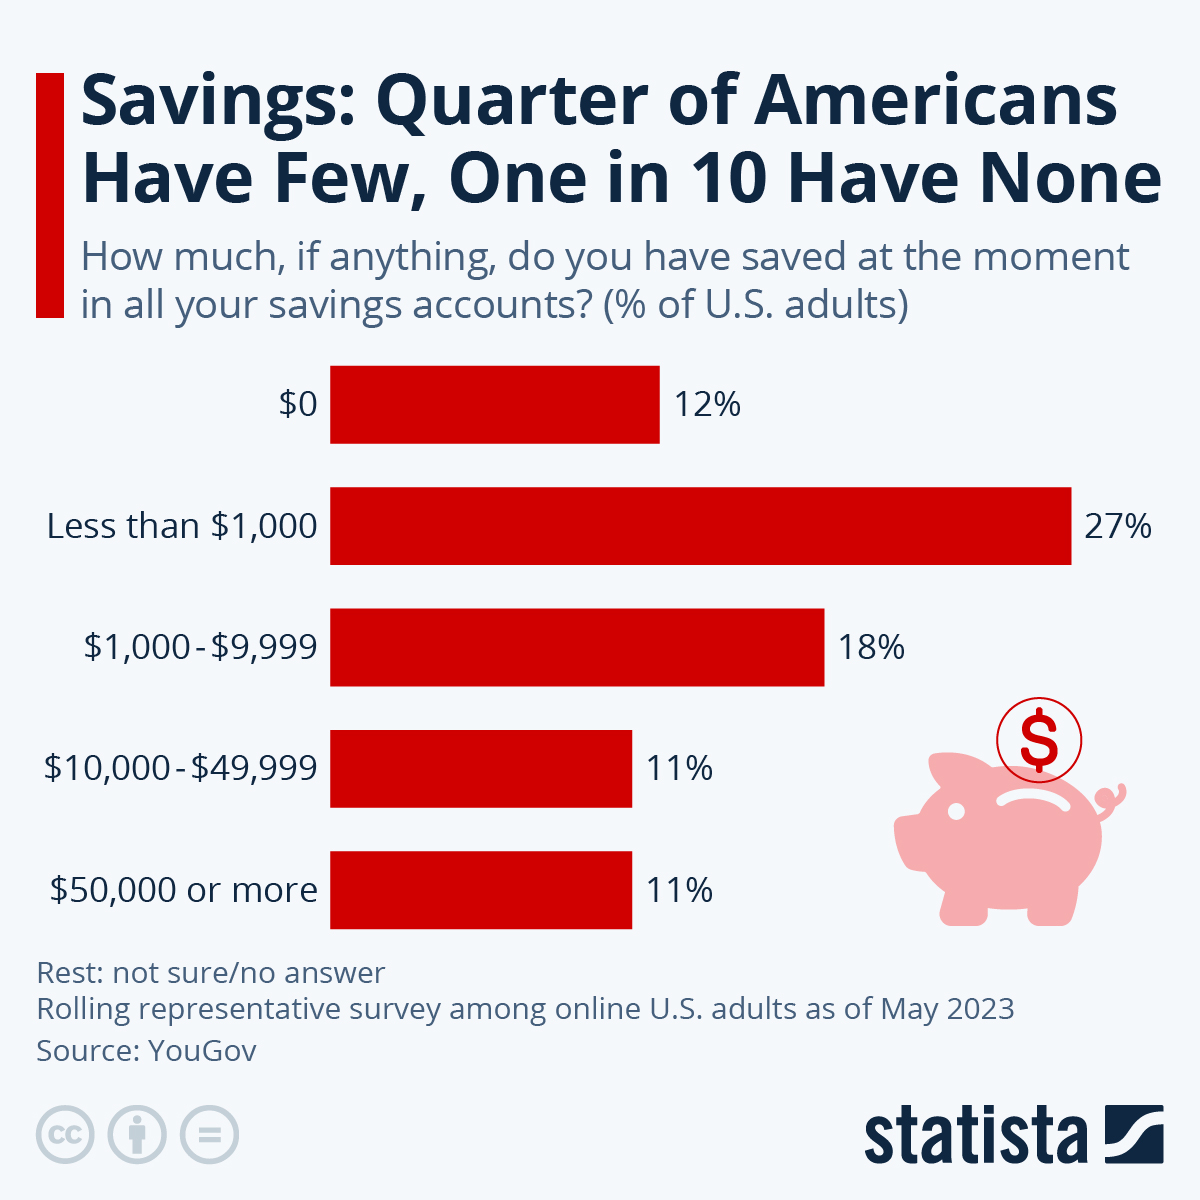 You will find more infographics at Statista
Of course the Oligarchy doesn’t want this information to be widely disseminated. And so they counter with this…
23. Most Americans own nothing of value.
Correspondingly Bottom 70% of Americans don’t own any real wealth (beyond rapidly depreciating durables).
- Wealth Inequality Is Way Worse Than You Think, And Tax …
- The economic reality for 70% of Americans – Page 10
- GOP Trickle Down Has 70% of Americans Near Financial …
- 70% Of All Americans Are Struggling Financially! CBS …
- State of Working America Wages 2019: A story of slow …
- If you thought income inequality was bad, get a load of …
24. The other side of the (non-existent) coin is that the same 50% of Americans would obviously struggle to come up with $400 for an unexpected expense. By extension, the former middle class – those with the miserly savings of $1,000 – would also have real troubles in coping with any kind of bill for medical treatment without dipping into more debt. Considering the above reported findings (see the chart) only the Top 10% would be financially secure in a medical emergency.
25. According to shocking findings by the American Cancer Society, 137.1 million US residents suffered medical financial hardship in 2018. Americans had to resort to borrow a total of $88 billion in 2018 only to cover for essential medical treatment.
26. A third of young adults, or 24 million of those aged 18 to 34, lived with in their parents’ home because they cannot afford a home of their own.
27. The income and wealth gap pictures get worse yet when we look at the age distribution of wealth. Younger generations are earning less and own next to nothing (that is, if you are not the golden youth of the 10%). Baby Boomers born between the end of the Second World War and 1964 currently hold wealth that is 11 times higher than that of millennials.
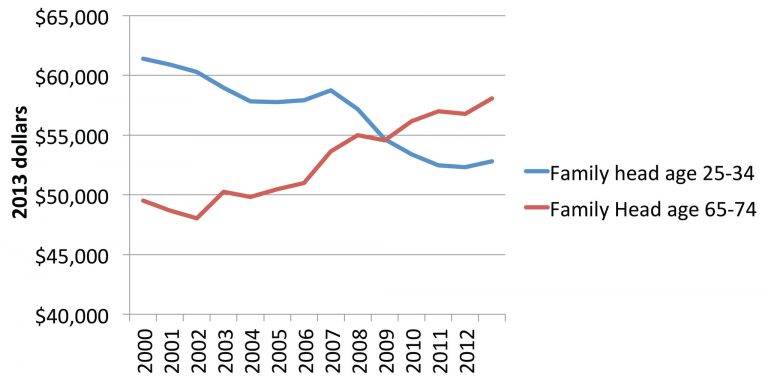
Median Income for Younger and Older Families in Inflation-Adjusted Dollars
28. Growth of “real” Jobs is zero.
The number of full-time jobs with life-sustaining wages – what economist David Stockman calls breadwinner jobs – have not been growing since 2000, by 2014 their number was still 3.5 million or 5% lower than it was at the peak in early 2001. In the same period 4 million part-time and gig jobs were created.
While the official unemployment figure is presently near historical lows – and at levels what some economists would like to call full employment – there are some big problems with it.
1. Problems with the official unemployment statistics. The officially touted unemployment figure (so-called U3 unemployment) record only those who have been looking for a job during the last 4 weeks, while discouraged long-term unemployed are cleansed from the statistics and left unrecorded as if they would not be in the workforce at all – makes stats look beautiful for the powers that shouldn’t be.
2. The labor participation rate has been falling.
3. New job creation has amounted to only a third of the annual increase in working age population.
4. Part-time and gig jobs count as full-time employment. Any person who takes a part-time or gig job for just a few hours a month is recorded among the employed, although they would rightly be considered unemployed merely clutching at straws.
5. Connected with the previous point, there is also a more general problem with the quality of jobs created. Most jobs created in the last two decades are low-paid low-skill jobs that do not provide a life-sustaining income considering the cost of living in the United States.
More than one third (36%) of U.S. workers are in the gig economy, doing part-time work or side hustles for companies like Uber, Lyft, Etsy, Amazon Mechanical Turk, Freelancer.com, Ebay or just any odd job they can get from time to time.
29. Debt Peonage.
To make up for the shrinking earnings, the American regime is pushing the American population into 21st century debt peonage.
Ensnared in the debt trap, US households had nearly $14 trillion in outstanding debt at the end of the third quarter 2019. That debt load now equals 73% of GDP. By end of 2019, consumption debt alone (not including asset acquiring mortgages) was up by $2 trillion since 2014.
- The disturbing reasons behind the ‘meteoric rise’ in …
- USA in a Debt Trap Death Spiral | New Eastern Outlook
- Avoiding the American Debt Trap – True Anomaly
- The debt trap: how the student loan industry betrays young …
- The U.S. Consumer Debt Crisis – Debt.org – America’s Debt …
Since 2004, the weight of the student loan millstone has gone up fivefold from only $250 billion to today’s $1.5 trillion.
That’s due to the huge price inflation in higher education. The cost of both public and private college escalated by 40% over the general consumer price inflation between 2005 and 2015.
30. Huge increase in the cost of living in the USA.
We mistakenly believe that the increase in the cost of living is universal around the world. Nope. It isn’t. Only the cost of living in the United States and Zimbabwe have increased exponentially. The rest of the world, not so much.
Because of the huge rise in the last few decades in cost of living in the US, in Russia, you get the same standard of living for a fraction of the American cost. A Moscow average monthly salary equal to $1,600 (annual $19,200) gives the same purchasing power as a monthly salary of $6,000 in Chicago (annual $72,000). Meaning, you live in Moscow (at least as well for a monthly paycheck of $1,600 as you live in Chicago for a paycheck of $6,000.
31. The “American Dream” is dead.
The present oligarch controlled rigged crony capitalist system has killed the American dream, the belief that anyone, regardless of parents’ social status and incomes can attain success and wealth by hard work and ingenuity.
- What happened to the American dream? | Financial Times
- What Happened To The American Dream? ‘Transaction Man …
- What Ever Happened to the American Dream: Burkett, Larry …
- What happened to the American dream? | TheHill
- What Has Happened to The American Dream? – The Atlantic
- What happened to the American Dream? – Baltimore Sun
- What Happened to the American Dream? | Two American …
- What happened to the American Dream? – Quora
- What Is the American Dream Today? – The Balance
The gates for upward mobility have been shut for the overwhelming majority.
The monopolization of practically all sectors of the economy, the ever increasing bureaucratic restrictions on doing business, the extreme concentration of ownership, and the rigged financial markets have made it increasingly hard for people outside the top echelon of penetrating the financial membrane protecting the elites.
A 2017 study by the Federal Reserve Bank of Cleveland found that the probability that a household outside the top 10% made it into the highest tier within 10 years was twice as high during 1984-1994 as it was during 2003-2013.
The United States is an oligarchy
This concentration of the income and wealth on the top, proves that the United States is an oligarchy.
A 2014, study by Princeton University https://www.businessinsider.com/major-study-finds-that-the-us-is-an-oligarchy-2014-4 demonstrated how the US is a political oligarchy.
With this report showing the insanely widening income and wealth inequality, my aim is to show, that the country is an economic oligarchy, too.
In fact, economic super riches are the precondition for their political power, too.
In America, as always, the oligarchy has achieved their uncontested power in a hermeneutical feedback loop, where the initial wealth of the superrich has bought them increased political power, which has given them increased riches, which has bought them more political power, and so on, until today, when they own practically the whole economy and the entire government.
Clearly the source of higher inequality has been Fed policies, which has pushed cheap money into the pockets of the already rich, who have exclusively then benefited from soaring stock and real estate prices.
Fittingly, we got end of 2019 a report revealing that the world’s richest people increased their wealth in the year by $1.2 trillion, a staggering 25%, most of which belong to the oligarchs of the United States.
Intentional or Accidental?
The question – which I have set to explore in my series of Capitalism in America – is whether there has been a game plan, a long-term strategy or whether intermittent achievements have just spurred the oligarchs on to new economic and political power grabs in the course of establishing their totalitarian rule.
I tend to think, there has been a long-term plan ever since the establishment of the Federal Reserve.
Thank you President Wilson.
The economic and political history of the United States provide so much circumstantial evidence, which supports the view that there has been a conspiracy of the Wall Street elite.
I shall return to this hypothesis in further installments to this series of Capitalism in America.
It is however clear – whether through a long-term plan or by a series of ad hoc interventions – the US financial elite has by now completed a creeping coup, which have delivered them absolute economic and political power.
In my investigation of the oligarchization of America – the creeping neoliberal oligarch coop, which set in full force since Reagan – I have so far completed these instalments:
The first installment was a study showing how all corporate ownership has been concentrated in the hands of the oligarchy, titled Extreme concentration of ownership in the United States http://blogengine.hellevig.net/post/2019/05/13/Extreme-concentration-of-ownership-in-the-United-States-.aspx
The second part was a study revealing how the oligarchy has totally taken over US media, titled The Oligarch Takeover of US Media http://blogengine.hellevig.net/post/2019/05/13/The-oligarchy-wields-totalitarian-control-over-the-media-through-just-a-few-corporations.aspx
The third installment was a report published on the Saker blog titled New World Order in Meltdown, But Russia Stronger Than Ever https://thesaker.is/new-world-order-in-meltdown-but-russia-stronger-than-ever/
The fourth installment, The Oligarch Takeover of US Pharma and Healthcare https://thesaker.is/the-oligarch-takeover-of-us-pharma-and-healthcare-and-the-resulting-human-crisis/ was also on the Saker blog.
Next due is a fifth report showing how from point of view of political science the oligarchy has destroyed the social fabric of the US economy and deliberately enacted laws that favor the few over the people. Of particular interest here is how the oligarchy has rigged the political system by institutionally solidifying the mendacious Janus- faced two-party system in order to remove any potential challenge to their rule.
Conclusion
Three points;
Point One
There are two classes in the United States; the rich and the poor.
Actually there are nine classes. But for this discussion it's the 0.1% against the 99.9%.

The 9 classes are...

The Oligarchy
The wealthy
The Per Diem
The upper class
The middle class
The Gig class
The low class
The Felon Class
The Sex Offender Class.
The door has slammed shut for most Americans. It is already decided. You are part of one group or the other. The days of being able to leave the “impoverished” and join the ranks of the wealthy are over. It is a fine childhood fantasy, but it will never happen. They best you can do is be slightly better than your peers. That’s all that you can possibly hope for.
Point Two
The United States is stratified by finances. There are two main class groupings of people; the rich and the poor. The government is controlled by the rich, which is a textbook definition of an oligarchy.
oligarchy

noun, plural ol·i·gar·chies.
a form of government in which all power is vested in a few persons or in a dominant class or clique; government by the few.
a state or organization so ruled.
the persons or class so ruling.
America, the United States, is an Oligarchy.
Part Three
The oligarchy, and the PTB (The Powers That Be) are one and the same. Nothing that is written here is unknown to them. They know about all of this, and they do expect everything to crash, or go through a “big reset”.
They plan on this, and have predicted it. They expect it to happen, and fully expect to survive through it. In their viewpoint, they will end up better placed afterwards.
Though, to the vast bulk of Americans, it is new information. Often dismissed as “conspiracy rubbish”.
It isn’t.
So what does all this mean?
- The United States is neither a Republic or a Democracy. It is an Oligarchy.
- Those that are in the Oligarchy realize that all Oligarchies collapse, and they have been trying to manage this collapse for the last decade.
- In fact, they want this collapse to happen, for they believe that not only will they survive it, but that their position, and the world, and society would be better afterwards.
- Those not part of the PTB Oligarchy will suffer.
- However, those that are resilient, able to discern, and adaptable will be able to “ride the waves of discord” and survive just as well as the oligarchy can.
You just need to change your ideas and attitudes about who you are and what your role is.
Last minute note…
https://www.yicaiglobal.com/news/american-families-only-half-as-rich--as-those-in-chinese-cities

Some food for thought (and controversy): Is the median net worth of American families really only HALF the net worth of Chinese families?

When looking at median net worth (rather than average!) this seems to be the case and points to significantly higher inequality in the US compared with China, which has its fair share of inequality nonetheless.

In addition, Chinese families are sitting on very valuable self-owned properties (often more than one actually), are less indebted and have higher savings.

What conclusions shall we draw from these perplexing numbers?

-Dr. Shirley Yu
Do you want more?
Do you want to see similar posts?
I hope that you found this post curious. Please take care. You can view other similar posts in my SHTF Index, here…
SHTF ArticlesArticles & Links
You’ll not find any big banners or popups here talking about cookies and privacy notices. There are no ads on this site (aside from the hosting ads – a necessary evil). Functionally and fundamentally, I just don’t make money off of this blog. It is NOT monetized. Finally, I don’t track you because I just don’t care to.
- You can start reading the articles by going HERE.
- You can visit the Index Page HERE to explore by article subject.
- You can also ask the author some questions. You can go HERE to find out how to go about this.
- You can find out more about the author HERE.
- If you have concerns or complaints, you can go HERE.
- If you want to make a donation, you can go HERE.
Please kindly help me out in this effort. There is a lot of effort that goes into this disclosure. I could use all the financial support that anyone could provide. Thank you.